

在米随随的Blog看到有关Firebug的介绍,遂下载试用了一下,确实是比较好的工具。
一、效果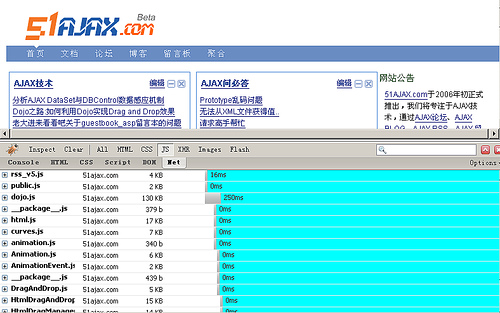
二、主要功能 Inspect and edit HTML Tweak CSS to perfection Visualize CSS metrics Monitor network activity Debug and profile JavaScript Quickly find errors Explore the DOM Execute JavaScript on the fly Logging for JavaScript
对于WEB开发人员来说,可以非常方便的得到自己想要的信息:HTML、DOM、CSS、JS,甚至各个文件的下载时间。
刚测试了一下JS的调试功能,非常方便,可以设置断点,鼠标移至变量名上,可以得到相应值的提示。太棒了!
三、非Firefox浏览器的解决方案:Firebug Lite
对于非Firefox浏览器,Firebug也有相应的解决方案—Firebug Lite,通过使用console.log()输出错误信息至Firebug 控制台。
1.下载Firebug Lite
下载地址:http://getfirebug.com/releases/firebuglite1.0-b1.zip,解压至WEB目录,比如/js/firebug/。
在页面中增加以下代码:
<script language="javascript" type="text/javascript" src="/path/to/firebug/firebug.js">script>如果不想安装Firebug Lite,只是为了避免Javascript错误,可以点击这里下载firebugx.js然后copy至代码中即可。
这个文件的代码如下:
if (!("console" in window) || !("firebug" in console)) { varnames = ["log", "debug", "info", "warn", "error", "assert", "dir", "dirxml", "group", "groupEnd", "time", "timeEnd", "count", "trace", "profile", "profileEnd"]; window.console = {}; for(var i = 0; i < names.length; ++i) window.console[names[i]] = function(){} }2.使用Firebug Lite
默认情况下,打开页面后,可以按F12开启Firebug的控制台,如果不想频繁按F12来进入调试状态,也可在HTML元素上增加debug=”true” ,如下:
3.使用命令行
Firebug也包含一个命令行程序,可以使用以下快捷键Ctrl+Shift+L (or ⌘+Shift+L on Mac)
4.测试页面
按 F12 或 Ctrl+Shift+L,就可以看到效果了。